
US National Debt Tops $40 Trillion: Five Numbers That Explain the Growing Fiscal Challenge
The United States has crossed a fiscal milestone that would have been difficult to imagine only a few decades ago: the country's gross national debt now exceeds $40 trillion.
U.S. Treasury figures show total public debt outstanding reached approximately $40.047 trillion on August 18, the first time the figure had moved above the $40 trillion mark. The previous $39 trillion milestone was reached in March, meaning roughly another trillion dollars was added in less than five months.
The headline number is enormous, but it does not tell the entire story. Understanding America's debt problem requires looking at how the debt is structured, why Washington continues borrowing, what interest costs are doing to the budget and where the numbers could go from here.
Here are five figures that put the $40 trillion milestone into perspective.
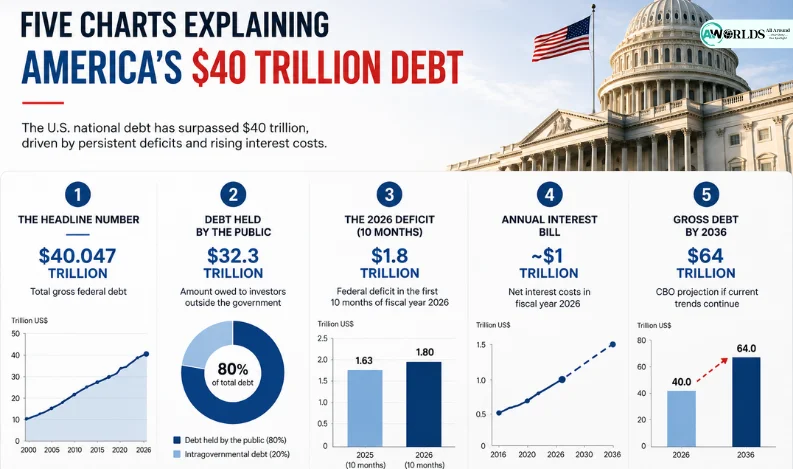
1. $40.047 Trillion: The Headline Debt Figure
The government's gross federal debt reached roughly $40.047 trillion when it crossed the milestone in August.
That represents a dramatic increase over the past decade. The gross national debt has approximately doubled within 10 years and is now more than twice the level recorded when Donald Trump first entered the White House in January 2017.
Debt does not rise simply because the government chooses to issue more bonds. It generally increases when federal spending exceeds revenue from taxes and other sources.
When Washington runs a budget deficit, the Treasury has to borrow to cover the difference. Repeated annual deficits therefore accumulate into a larger national debt.
Economic downturns, emergency spending, tax policy, military expenditures, Social Security and Medicare commitments and pandemic-era support programmes have all played roles in the long-term increase.
The speed of the latest rise has attracted particular attention because the debt moved from $39 trillion to $40 trillion in less than five months.
2. $32.3 Trillion: The Portion Held by the Public
Not every dollar included in the $40 trillion total represents money owed to outside investors.
When the milestone was reached, approximately $32.266 trillion consisted of Treasury securities held by the public, while roughly $7.782 trillion represented intragovernmental holdings.
Debt held by the public includes Treasury securities owned by investors outside federal government accounts. Holders can include individuals, banks, pension funds, mutual funds, insurance companies, the Federal Reserve and overseas investors.
Intragovernmental debt is different. It reflects money that one part of the federal government owes another, including securities held by government trust funds.
Economists therefore often pay particularly close attention to debt held by the public relative to the size of the economy, rather than relying solely on gross debt.
The Congressional Budget Office expects debt held by the public to equal around 101% of U.S. GDP in 2026, before climbing further during the next decade.
The International Monetary Fund uses a broader general-government measure and projects U.S. general government gross debt at about 125.8% of GDP in 2026. The figures are not directly interchangeable because the CBO and IMF definitions cover different measures of government debt.
3. $1.8 Trillion: The Deficit in Just 10 Months
The national debt continues growing because the federal government remains structurally in deficit.
The Congressional Budget Office estimated that the federal deficit reached approximately $1.8 trillion during the first 10 months of fiscal year 2026, which runs from October 1, 2025, through September 30, 2026.
That was about $169 billion higher than during the comparable period a year earlier.
For the full 2026 fiscal year, the CBO's baseline projection calls for federal spending of roughly $7.4 trillion against revenues of about $5.6 trillion, resulting in a projected deficit of approximately $1.9 trillion.
That gap illustrates the central problem behind the debt trajectory.
Even without a recession or another major emergency, the government is spending substantially more than it collects.
Closing a deficit of that scale would ultimately require some combination of stronger revenues, lower spending, faster economic growth or changes to major federal programmes.
Without such adjustments, borrowing fills the gap.
4. Around $1 Trillion: The Annual Interest Bill
Borrowing creates another problem: debt itself becomes increasingly expensive.
The CBO expects net federal interest costs to reach around $1 trillion in fiscal 2026, up roughly $69 billion from 2025.
This creates a difficult feedback loop.
As debt increases, the government pays interest on a larger amount of outstanding borrowing. Higher market interest rates can make refinancing that debt more expensive. Rising interest spending then adds to federal expenditures, potentially increasing future deficits and requiring additional borrowing.
The CBO estimates net interest payments will amount to roughly 3.3% of GDP in 2026.
By 2036, that share is projected to rise to 4.6% of GDP, with interest approaching one-fifth of total federal spending under the agency's current baseline.
That matters because every dollar devoted to servicing existing debt is a dollar that cannot be used elsewhere without collecting more revenue or borrowing additional money.
Higher Treasury yields can also have effects outside Washington.
U.S. government bond yields influence financing conditions throughout the economy. Sustained increases can feed into mortgage rates, business borrowing costs and other forms of credit.
5. $64 Trillion: Where Gross Debt Could Be by 2036
The $40 trillion milestone may not remain a milestone for long if current fiscal trends continue.
CBO projections indicate gross federal debt could reach around $64 trillion by the end of 2036, an increase of roughly $24 trillion over the coming decade.
Debt held by the public is projected to rise from around 101% of GDP in 2026 to 120% by 2036, moving above the previous post-World War II record.
At the same time, the annual federal deficit is projected to expand from around $1.9 trillion this year to roughly $3.1 trillion in 2036.
The CBO expects deficits to remain well above their historical average relative to the economy throughout the projection period.
Rising Social Security and Medicare costs, persistent primary deficits and higher interest expenses are among the major forces driving the outlook.
Does $40 Trillion Mean the US Is Heading for Default?
Not necessarily.
The size of the debt alone does not mean the United States is about to become unable to meet its obligations.
The U.S. operates the world's largest economy, borrows in its own currency and supports one of the deepest government bond markets in the world. Treasury securities also remain central to global financial markets and are widely held by institutions and governments.
Foreign demand has not disappeared either. Treasury data for June showed foreign investors remained active buyers of U.S. long-term securities, with net foreign purchases of long-term U.S. securities reaching $207.1 billion during the month.
The larger concern is what persistent borrowing does over time.
A heavier debt burden can consume a growing share of government revenue through interest payments, reduce fiscal flexibility during recessions or emergencies and increase sensitivity to movements in borrowing costs.
It can also create difficult political choices over taxes and spending.
The Bigger Question Is What Happens Next
Crossing $40 trillion is therefore more than a symbolic event.
The more important issue is whether the gap between federal spending and revenue begins to narrow.
CBO projections suggest that without significant changes, deficits will remain historically large and federal debt will continue climbing faster than the economy over the next decade.
That leaves Washington facing an increasingly difficult equation.
Reducing deficits substantially could require politically challenging decisions involving taxes, entitlement programmes and government spending. Delaying those decisions, however, risks allowing interest costs and accumulated debt to make future adjustments even more difficult.
The $40 trillion figure may capture the headlines today. The trajectory behind it is what investors, taxpayers and policymakers will be watching next.
More News:-







Recent Comments:
No comments yet.